Listening to a decade of magma dynamics at Kīlauea volcano
This post accompanies the 2023 EOS article "Earth is Noisy. Why Should Its Data Be Silent?" by L. Karlstrom, B. Holtzman, A. Barth, J. Crozier, A. Pate. Read the article HERE
Summary of the data
The summit vent of Kīlauea Volcano was active from 2008-2018, hosting a nearly continuous active lava lake that provided a window into the underlying magma system (Patrick et al. 2021). This summit activity was accompanied by effusive eruptions along the Kīlauea’s East Rift Zone, and culminated with a damaging East Rift Zone eruption that produced ~1 cubic kilometer of magma and induced a months-long sequence of earthquake-generating caldera collapse events at the summit (Neal et al. 2019).
Analysis of this decade-long eruption, as well as more than a century of preceding study, has made Kīlauea one of the world’s best understood active volcanoes. The general structure of Kīlauea’s shallow magma system has been known for decades, but has been continually refined by new activity and analysis, and many questions about the storage and transport of melt and volatiles remain unanswered (Poland et al. 2021).
Please be aware of flashing lights in this video.
Scientific illustrations of Kīlauea plumbing
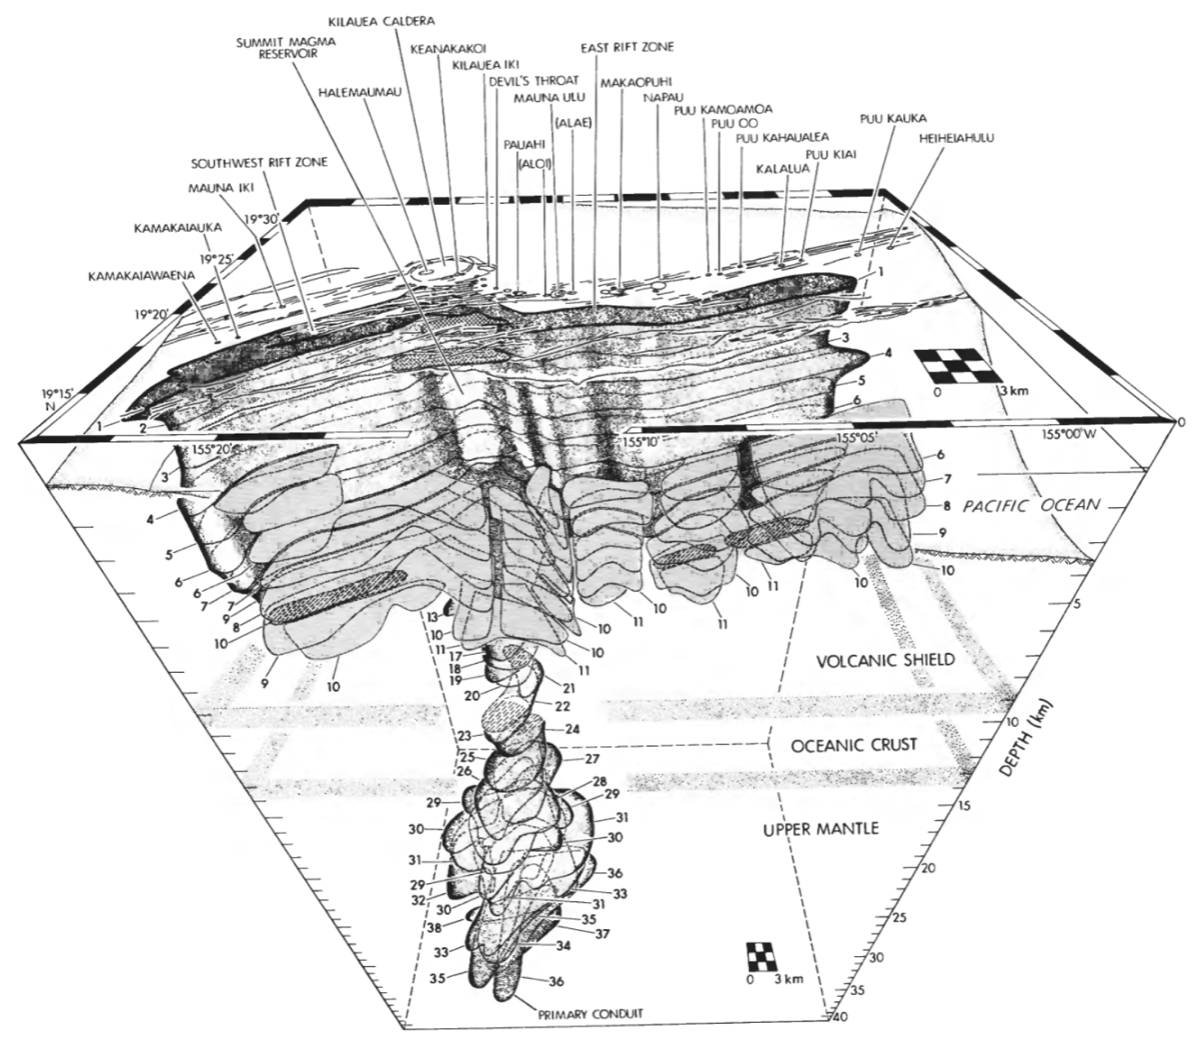
A good illustration obviates text. The classic illustration in Ryan (1987) below has been highly influential in the conceptual framing of Kīlauea magma transport. But with >30 years more data, we are in a position to improve on this.
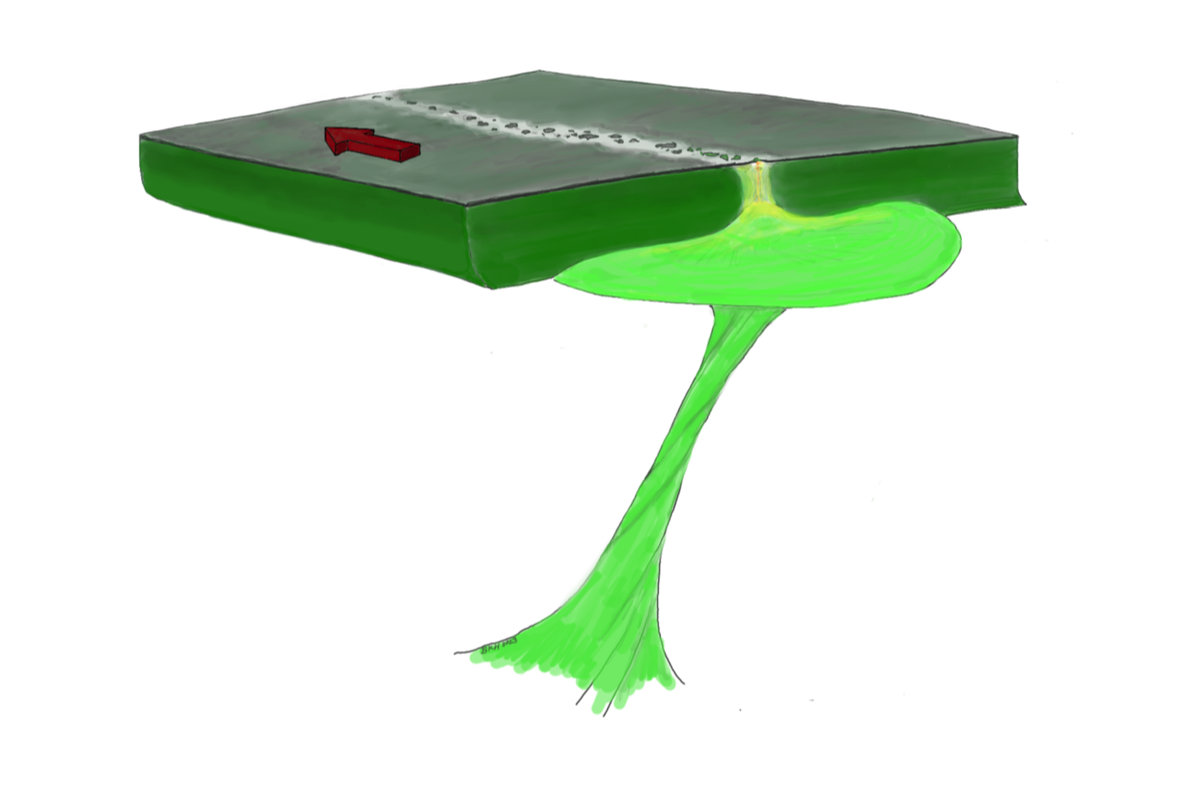
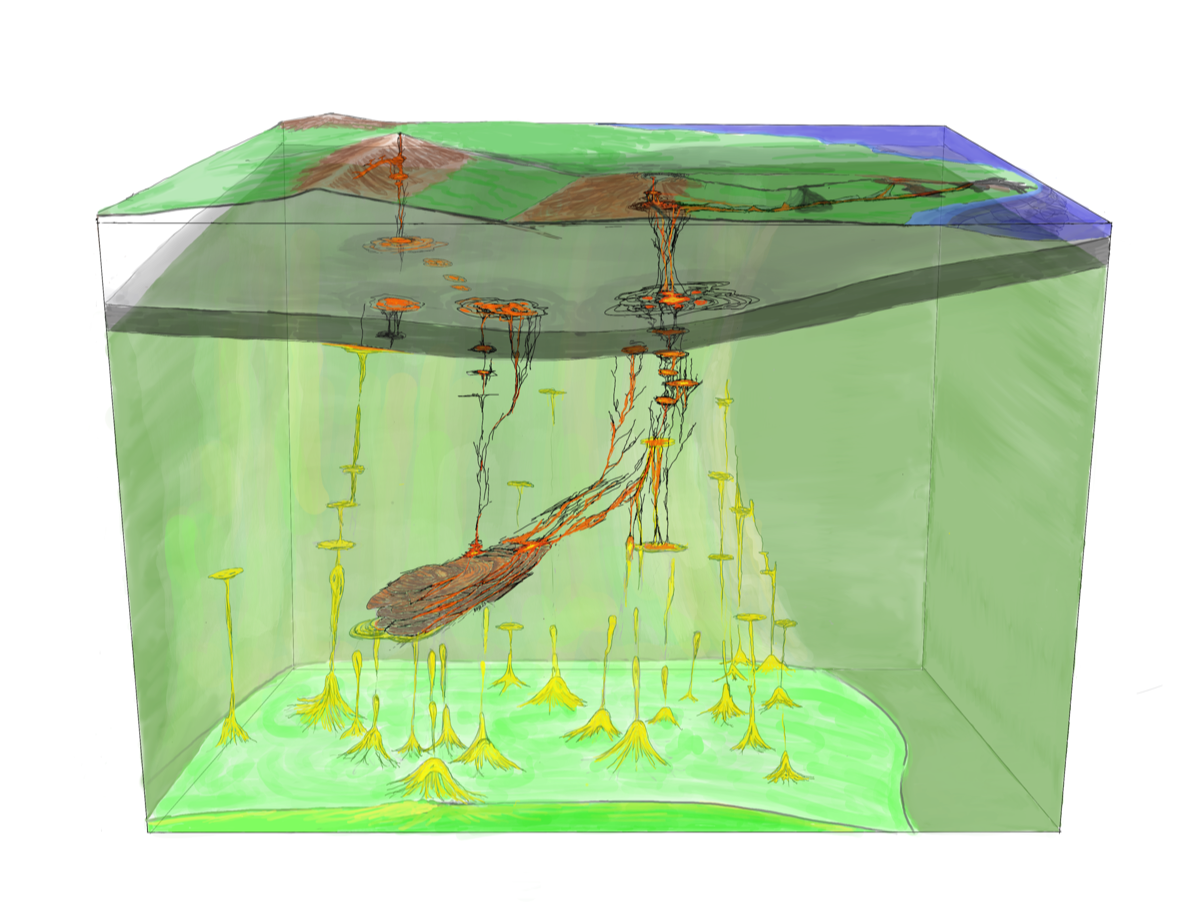
The series of sketches below by Ben Holtzman provide a modern (as of 2023!) view on the structure of volcanic plumbing of Kilauea volcano, from mantle to surface.
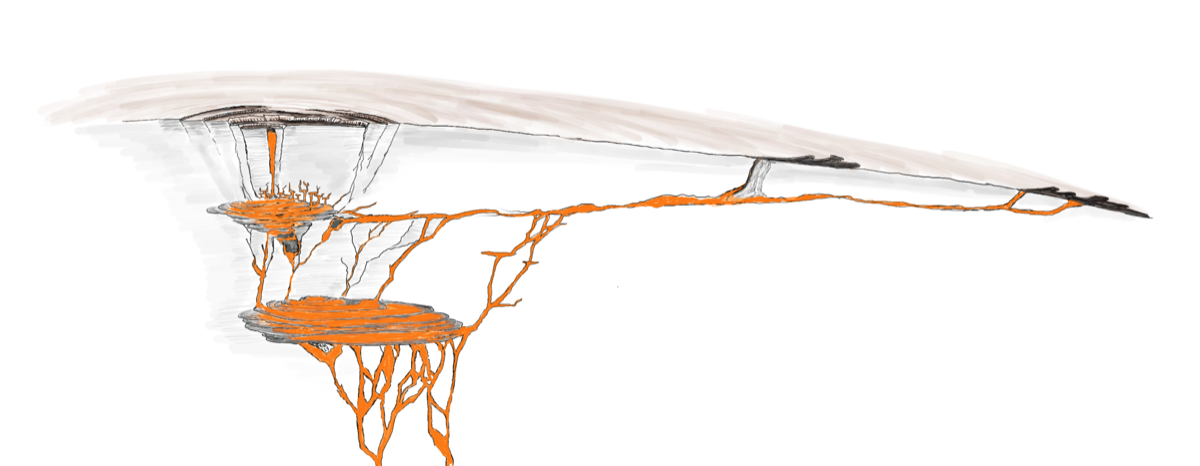
Final zoom to the scale of Kīlauea volcano, illustrating the two known summit reservoirs, and magma transport pathways down the East Rift Zone that were variably active during the 2008-2018 eruptive sequence. Magma is inferred to be stored in a reservoir 1-2 km beneath the summit vent, in another region at 3-5 km death, and along dikes extending from the summit to the volcano's rift zones. During much of the 2008-2018 sequence a direct conduit existed between the 1-2 km deep reservoir and the summit lava lake (Poland et al., 2012), which allowed the lava lake to serve as a pressure gauge for the reservoir. Drawing by Ben Holtzman.
Data sonification
The EOS article and full data movie represent magma dynamics over two distinct time periods, the decade of activity between 2008-2018, and then the catastrophic caldera collapse sequence in 2018. Below we describe the sonification approaches used in each movie segment in more detail.
We also provide stand-alone movies (without voice-over or storyboard) of the two time periods. We made a 60s version and a 120s version - you can hear different aspects of the timeseries by focusing on the large scale arc of the dataset or the details!
Codes (Python Jupyter notebooks) used to generate sonifications similar to what is used here may be found at the Seismic Sound Lab website.
Please be aware of flashing lights in this video.
Please be aware of flashing lights in this video.
Direct sonification of near-summit earthquakes
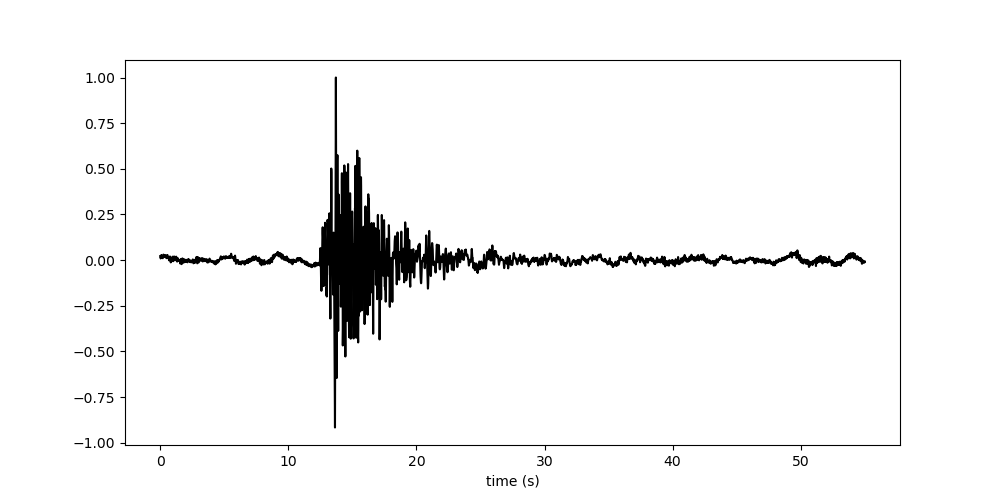
For oscillatory data like contain in seismograms, we can simply speed up a waveform until the signal resides in the human auditory band (20 Hz - 20 kHz). Below is an example of a waveform, downloaded from IRIS, using the vertical component at station PUHI.
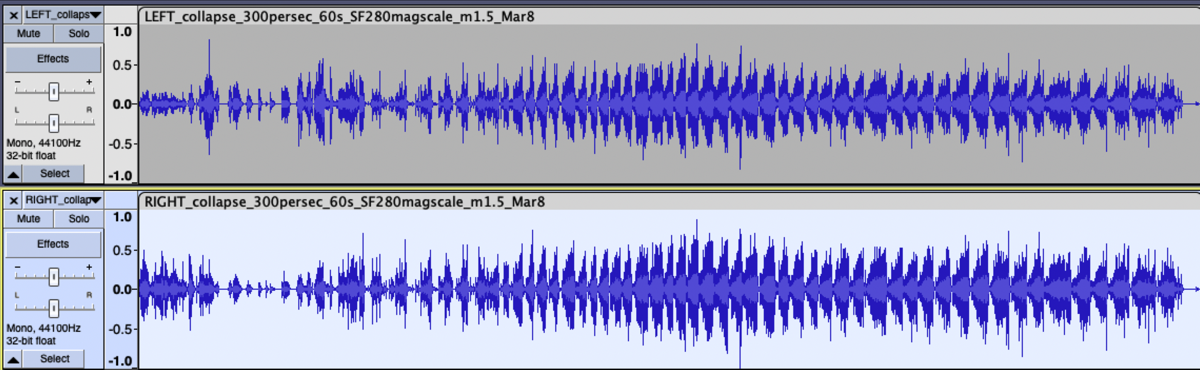
Finally, we utilized stereo sounds by panning events with hypocenters west and east of Halema'uma'u crater left and right. The stereo audio waveforms are shown below (for 2018).
GNSS and tilt data
For the 2008-2018 sequence we use geodetic data from Kīlauea summit GNSS network stations UWEV and CRIM (Crozier and Karlstrom, 2022). This approximates the inflation of the shallow Halema'uma'u reservoir at the volcano summit (although the deeper South Caldera reservoir also contributes).
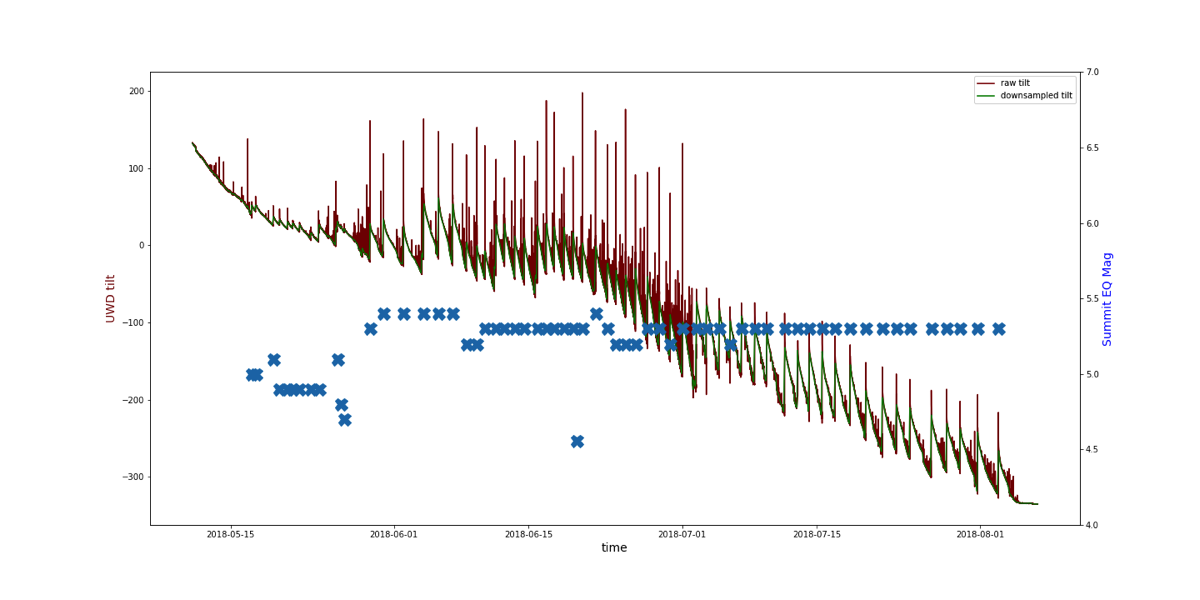
For the 2018 collapse sequence, we use ground tilt recorded by the UWE tiltmeter near the volcano summit. This station provides an exceptional (and unusually low noise) record of summit deformation during the caldera collapse.
GNSS sonification
We use a "chord swell" parameter mapping sonification for GNSS data over 2008-2018. We chose a Lydian scale with 2.5 octave range, then progressively add or subtract notes according to variation in the data.
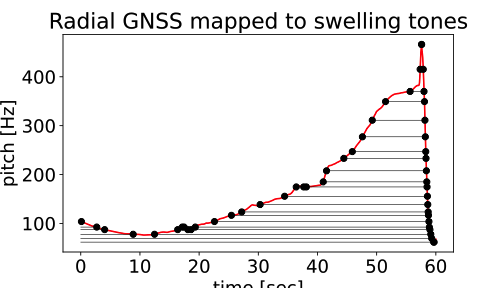
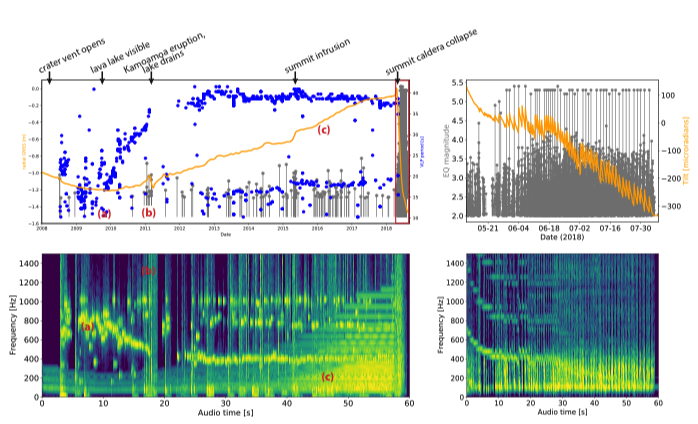
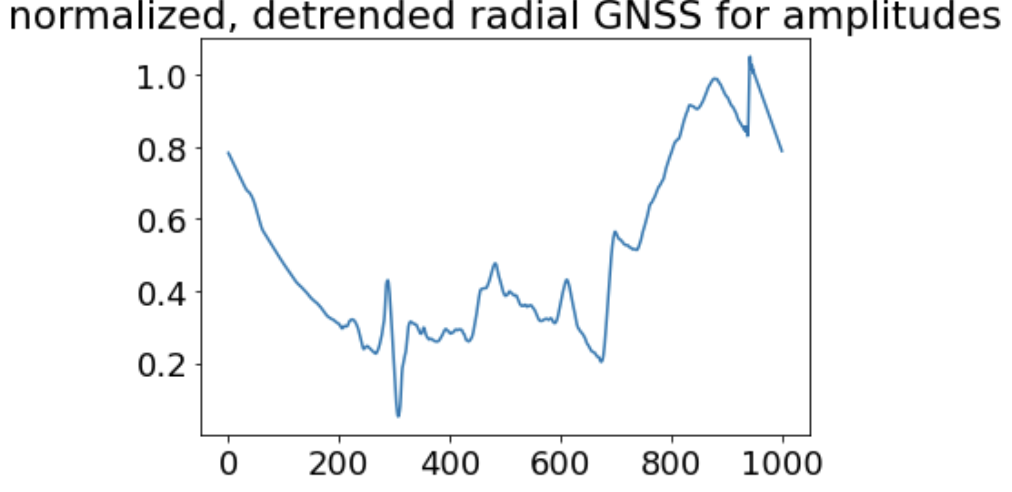
Loudness of the sound is mapped to detrended GNSS, plotted below. This permits to some degree a differentiation between long and short timescale variations in deformation.
Tilt sonification
We use a "chord sweep" parameter mapping sonification for UWE tilt over the 2018 collapse sequence. The approach is based on Barth et al., (2020), and involves sweeping a tone cluster up and down according to the variation in the data. We use an octatonic scale to define the chord in this case.
Very Long Period (VLP) seismicity sonification
During the 2008-2018 sequence, the Halema'uma'u summit crater rim rocks periodically collapsed into the summit lava lake. These often bus-sized impactors caused resonant oscillations in the Kīlauea shallow conduit and magma reservoir, that were recorded as VLP seismicity.
These events are remarkably tonal, consisting of a small number (often 1-3) dominant frequencies that decay over time. However, they are short duration, meaning that direct sonification leads to short sounds that do not well represent the waveform.
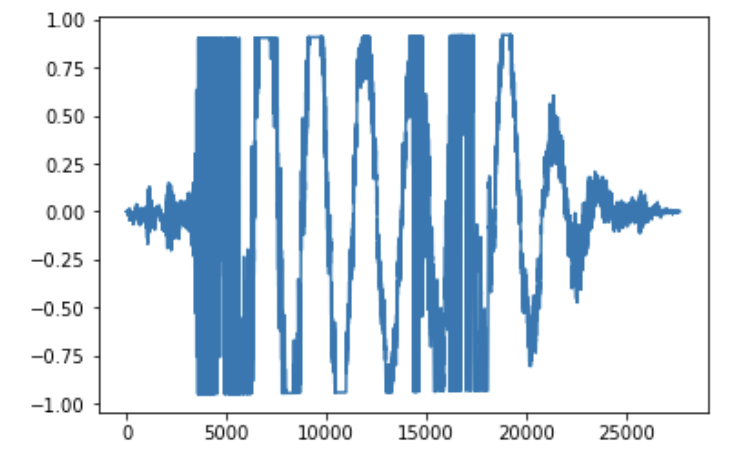
Below is an example of a direct sonification from an event on May 21, 2017. Speed factor is 7000, to put the dominant period of ~40s = 0.025 Hz at an audible frequency of 175 Hz.
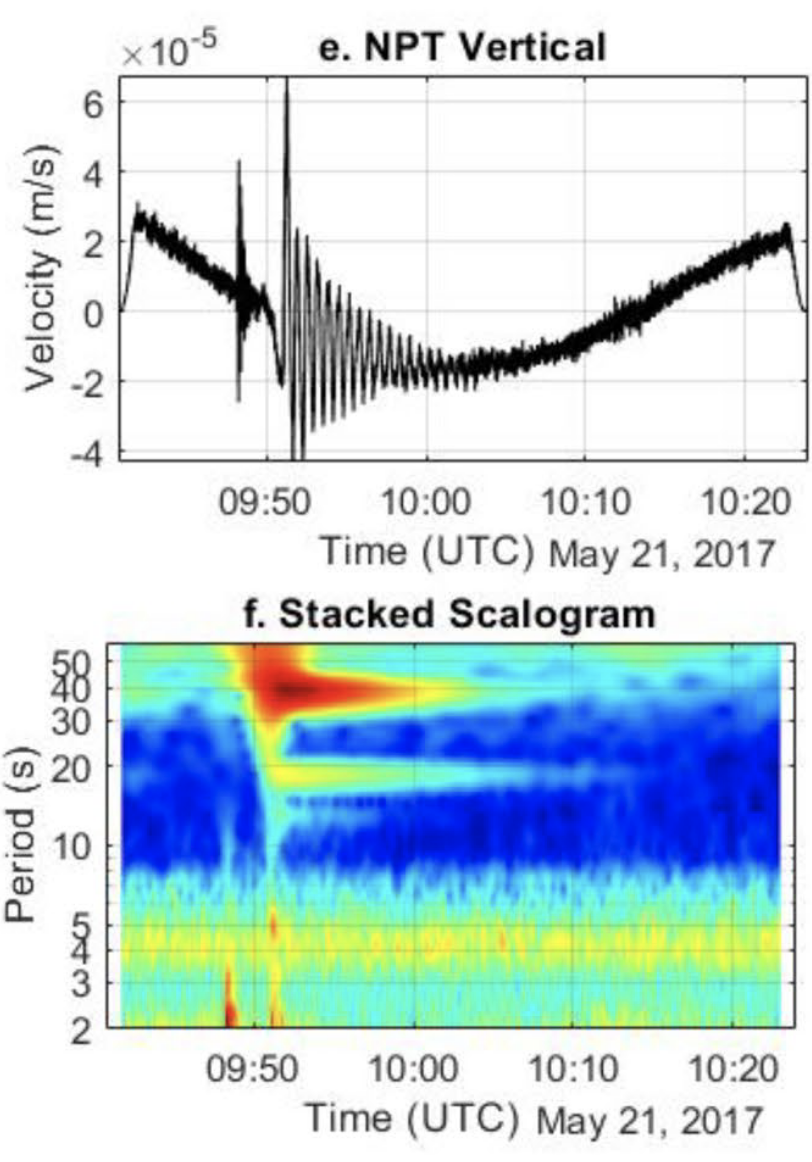
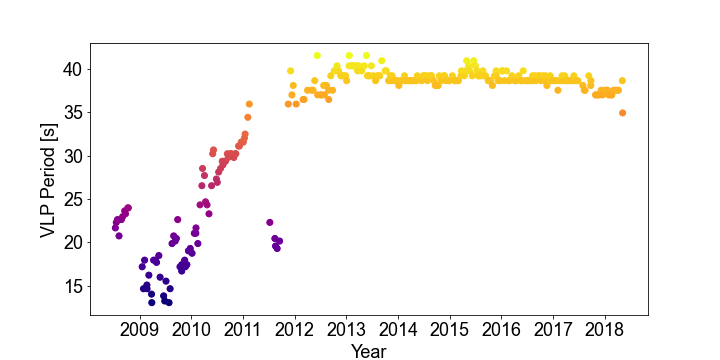
This fundamental mode varied in systematic ways through time - the plot above shows this variation over 2008-2018. Higher frequency modes, associated with sloshing in the lava lake and other resonant motions also vary through the timeline.
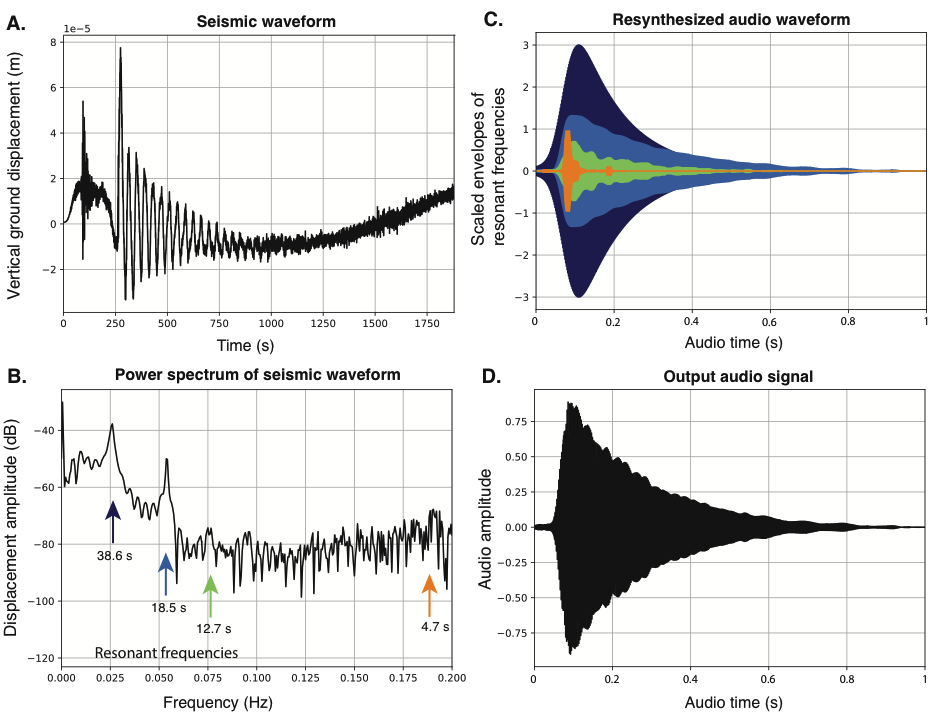
"Additive Resynthesis" Sonification
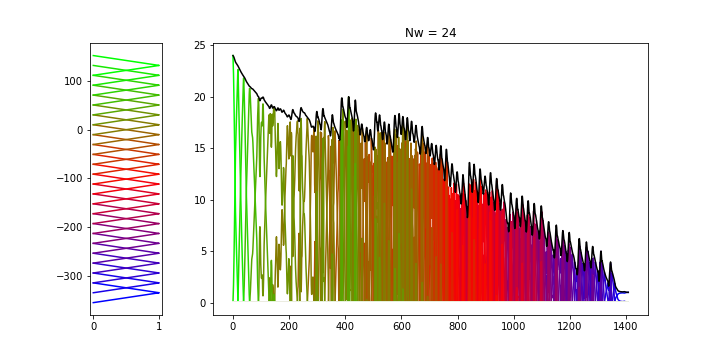
We sonify VLP seismicity by extracting envelopes from wavelet scalograms based on the catalog in Crozier and Karlstrom (2022). We then synthesize pure sinusoidal tones for each resonant mode, in the audible band but preserving the relative spacing of frequencies in the seismic data.
We then choose an overall duration for the event (1 sec in the data movie) and add together these resynthesized sounds. Each event is sonified this way, with catalog providing variation through time.
References
Barth, A., Karlstrom, L., Holtzman, B. K., Paté, A., & Nayak, A. (2020). Sonification and animation of multivariate data to illuminate dynamics of geyser eruptions. Computer Music Journal, 44(1), 35-50.
Crozier, J., & Karlstrom, L. (2021). Wavelet‐Based Characterization of Very‐Long‐Period Seismicity Reveals Temporal Evolution of Shallow Magma System Over the 2008–2018 Eruption of Kīlauea Volcano. Journal of Geophysical Research: Solid Earth, 126(6), e2020JB020837.
Crozier, J., & Karlstrom, L. (2022). Evolving magma temperature and volatile contents over the 2008–2018 summit eruption of Kīlauea Volcano. Science Advances, 8(22), eabm4310.
Karlstrom, L., B. Holtzman, A. Barth, J. Crozier, and A. Paté (2023), Earth is noisy. Why should its data be silent?, Eos, 104, https://doi.org/10.1029/2023EO230196. Published on 9 June 2023.
Leahy, G. M., Collins, J. A., Wolfe, C. J., Laske, G., & Solomon, S. C. (2010). Underplating of the Hawaiian Swell: evidence from teleseismic receiver functions. Geophysical Journal International, 183(1), 313-329.
Liang, C., Karlstrom, L., & Dunham, E. M. (2020). Magma oscillations in a conduit‐reservoir system, application to very long period (VLP) seismicity at basaltic volcanoes: 1. Theory. Journal of Geophysical Research: Solid Earth, 125(1), e2019JB017437.
Paté, A., Farge, G., Holtzman, B. K., Barth, A. C., Poli, P., Boschi, L., & Karlstrom, L. (2022). Combining audio and visual displays to highlight temporal and spatial seismic patterns. Journal on Multimodal User Interfaces, 1-18.
Patrick, M. R., Houghton, B. F., Anderson, K. R., Poland, M. P., Montgomery-Brown, E., Johanson, I., ... & Elias, T. (2020). The cascading origin of the 2018 Kīlauea eruption and implications for future forecasting. Nature Communications, 11(1), 5646.
Poland, M. P., Carbone, D., & Patrick, M. R. (2021). Onset and evolution of Kīlauea's 2018 flank eruption and summit collapse from continuous gravity. Earth and Planetary Science Letters, 567, 117003.
Ryan, M. P. (1987). Elasticity and contractancy of Hawaiian olivine tholeiite and its role in the stability and structural evolution of sub-caldera magma reservoirs and rift systems, Ch. 52 of Volcanism in Hawaii: U.S. Geological Survey Professional Paper 1350, 1667 pp., https://pubs.usgs.gov/pp/1987/1350/.
Shelly, D. R., & Thelen, W. A. (2019). Anatomy of a caldera collapse: Kīlauea 2018 summit seismicity sequence in high resolution. Geophysical Research Letters, 46(24), 14395-14403.
Wilding, J. D., Zhu, W., Ross, Z. E., & Jackson, J. M. (2023). The magmatic web beneath Hawai ‘i. Science, 379(6631), 462-468.