Volcano visualization
A modern take on "Comparative Heights of Mountains"
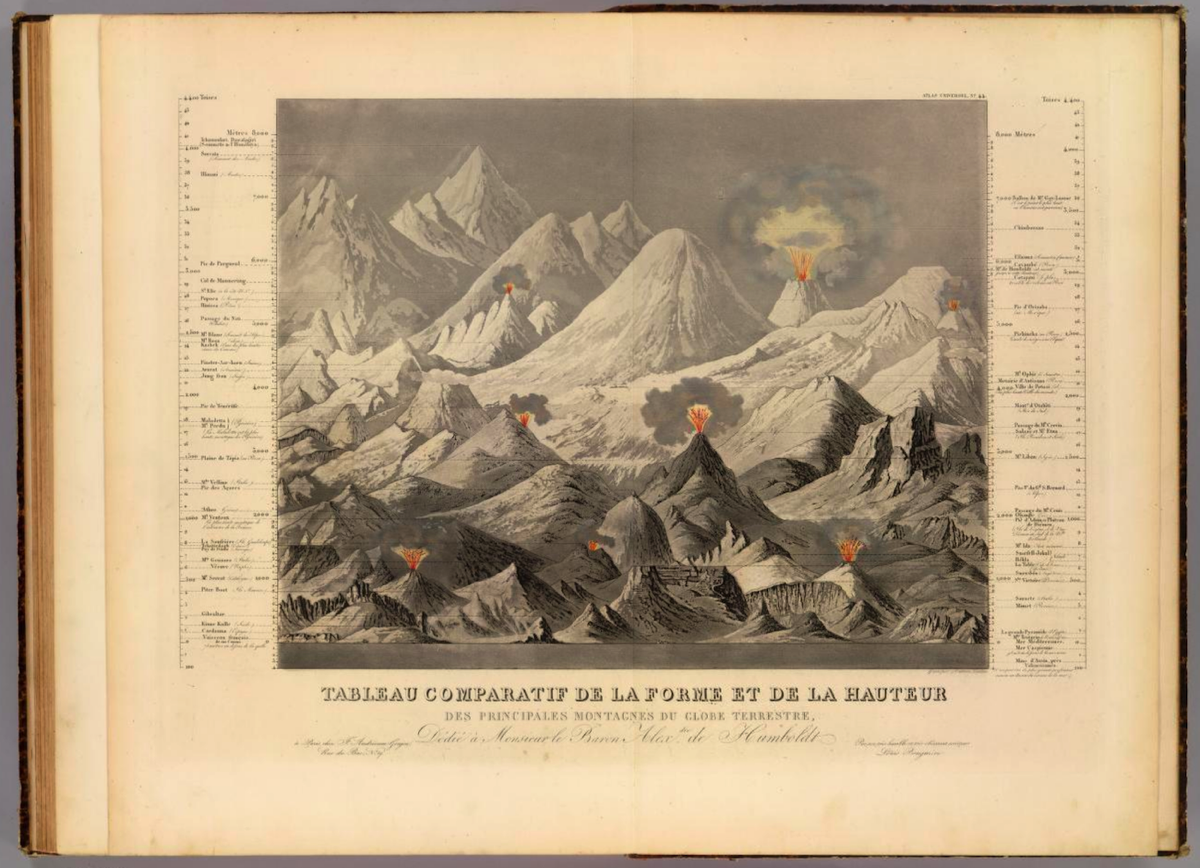
Before the digital age, cartography and geographic discussion often used relative comparisons to understand the relationships between natural features on large spatial scales (Wolman, 1972). A common theme, which gained prominence in 19th century atlases, was "The Comparative Heights of Mountains and Lengths of Rivers".
The figure shows an example (Andriveau-Goujon, 1850), excerpted from a compilation at the David Rumsey Historical Map Collection.
We have re-imagined this concept using modern, satellite-derived topographic data
The end product, a poster we're calling Three Views of Cascades Volcanoes, is based on the paper by O'Hara et al. (2020). It was made as a fundraiser for wildfire relief following the devastating Cascades forest fires in 2020.
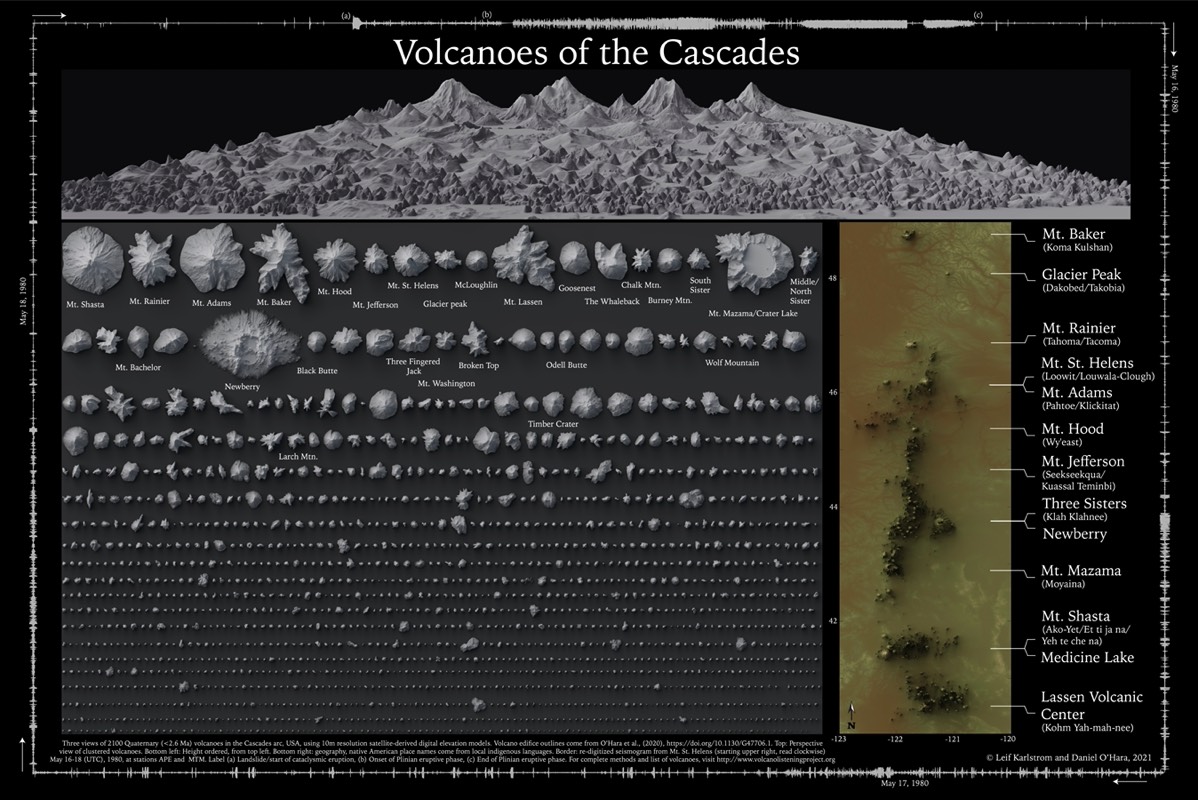
CLICK HERE for an annotated list of official volcano names used on the poster, as well as a reference list for Native American names.
Here is a written summary of our visualization approach
by Dan O'Hara
1) We first extract volcano topography from Digital Elevation Models (DEMs). Using the Sisters Volcano Complex in central OR as an example (Figure 1.A), we determine edifice boundaries by first calculating topographic slope of a mapped region (Figure 1.B).
2) We then postulate that highest slope areas correspond most to volcanic edifice, and thus generate a logical map of areas that have slopes higher than a threshold value (Figure 1.C). Afterwards, we filter the map using a set of low-pass values, contour the resulting grid, and distinguish contours that follow an elliptical shape (Figure 1.D).
3) Topography is then cut around each contour and processed using the Modified Basal Outlining Algorithm (MBOA; Bohnenstiehl et al., 2012), which automatically determines an edifice boundary from topography from a set of user-defined criteria. Doing this over the entire map, we generate a set of boundaries that encompasses a variety of scales and morphologies (Figure 1.E).
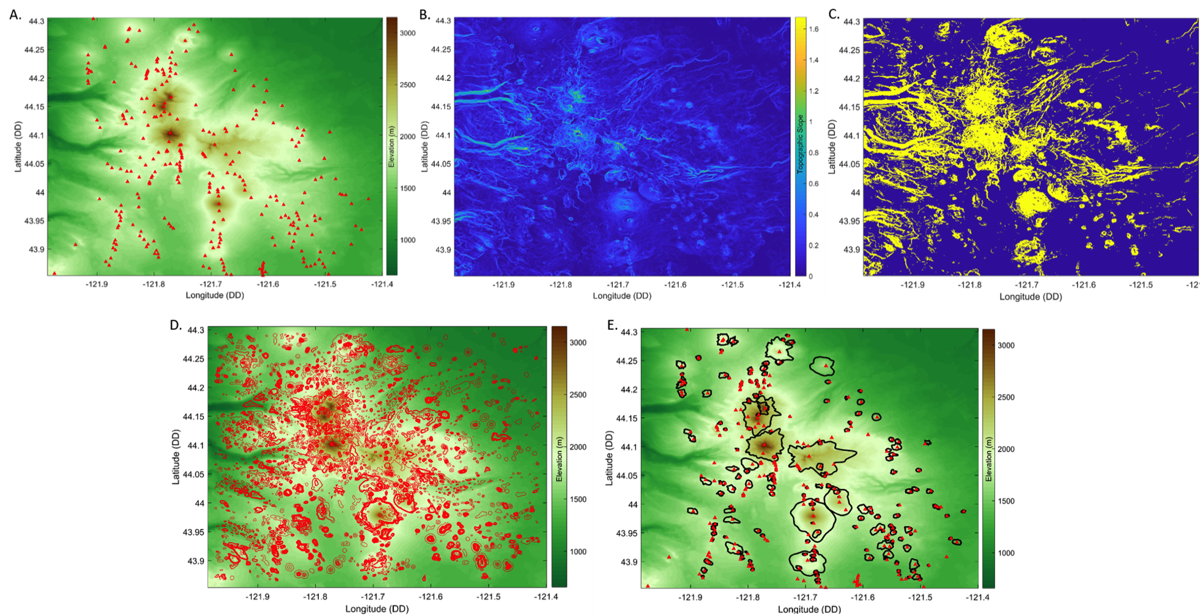
Figure 1: Edifice boundary extraction algorithm for the Sisters Volcano Complex (central OR). A: Topography of the Sisters Volcano Complex, red triangles are vent locations. B: Topographic slope. C: Logic map, yellow pixels corresponding to areas that have slope higher than a threshold value. D: Contours of filtered logic map. E: Derived edifice boundaries.
After determining boundaries for ~2100 edifices in the Cascades, we tested a variety of layouts to better visualize the size relationships of edifices. In each layout, we cut the topography of the volcano from DEMs using the derived boundary, then transpose the topography into a new arrangement. For example, we tested an edifice layout that better illustrates the density of volcanic edifices throughout the Cascades (Figure 2). Here, we spatially displaced overlapping edifice boundaries while keeping the relative geographic ordering. To accomplish this, we loaded the boundaries into QGIS, then moved each boundary by hand into the closest open space, keeping the largest edifices at their original locations (Figure 2.A-C). Afterwards, we transposed the topography of each edifice to the new position of their boundary using a unique identifier, and compacted the resulting image in the north-south direction to remove white space associated with the spacing of magmatic centers (Figure 2.D).
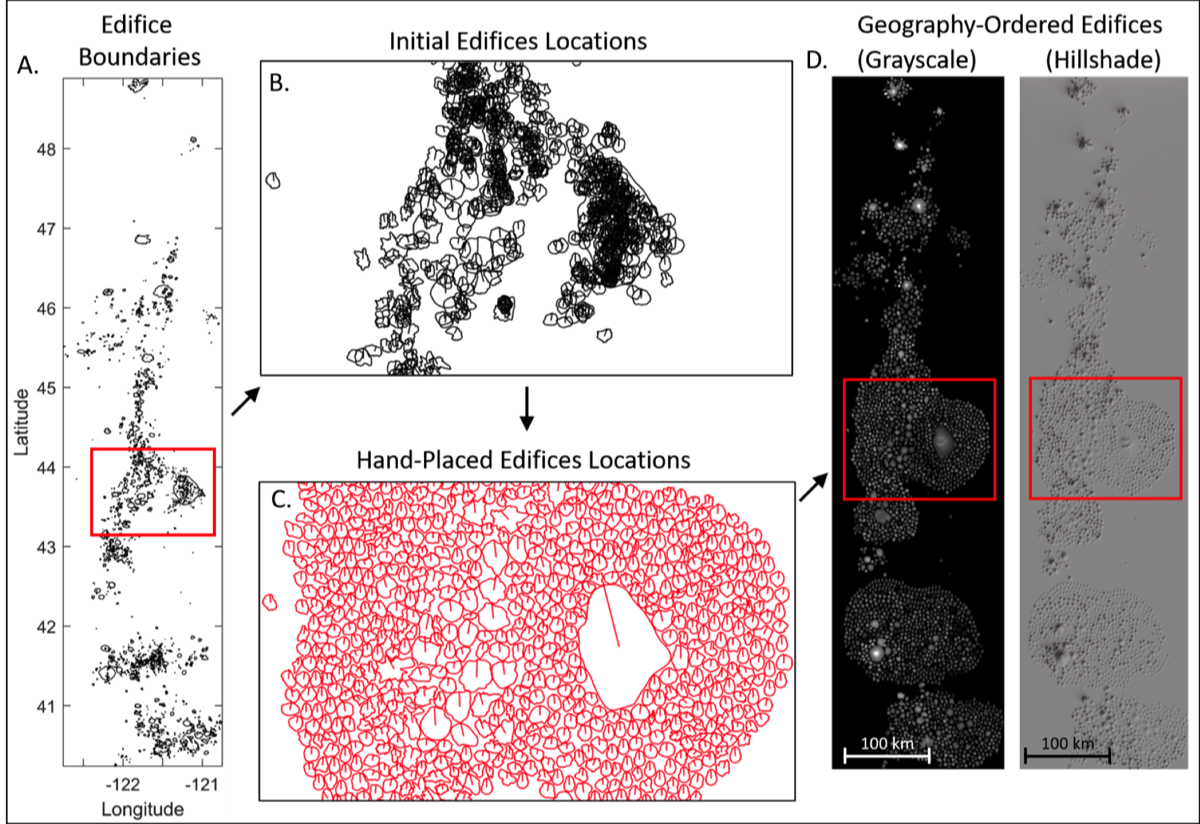
Figure 2: Edifice density image creation.* A:* Original edifice boundaries for the entire U.S. portion of the Cascades. B: Zoom-in of original boundaries in central OR (Newberry Shield and Sisters Volcano Complex). C: Manual relocation of edifice boundaries to remove spatial overlap. D: Grayscale and hillshade image of resulting map with all edifices spatially separated.
Regardless of the layout, scaling became an apparent issue as many of the monogenetic cones were so small they could not be easily visualized when compared to the larger stratovolcanoes. To overcome this, we increased the sizes of smaller edifices using a power-law relationship relative to the largest volcano, the Newberry Shield (Figure 3.A). Using an exponent of 0.6, we scaled the smaller cones to ~20% the size of Newberry (Figure 3.B). To generate the perspective view of the relative sizes of edifices, we created a simple algorithm that determines edifice placement by minimalizing a cost function. We first generate a cost function grid, then starting with the highest edifice we moved the edifice boundary across the grid, calculating the sum of costs within the boundary during each shift (Figure 3.C). Afterwards, we find the position that generated the lowest cost, move the edifice to that location (masking the cost function grid by the footprint of the edifice), and analyze the next highest edifice. Finally, we again transpose topography to the new edifice boundary locations and generate the elevation grid used for the perspective view (Figure 3.D).
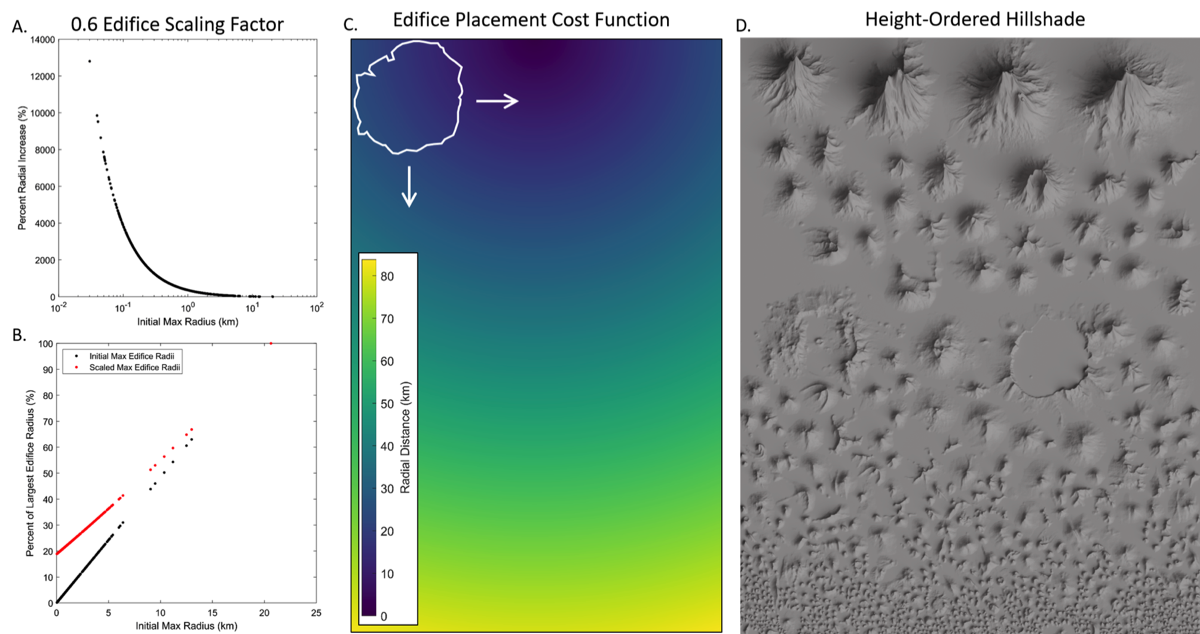
Figure 3: Edifice scaling and creation of the height-ordered perspective image.* A:* Power-law scaling of edifices. B: Radial size increase of edifices relative to the Newberry Shield. C: Cost function grid used to determine edifice placements. D: Hillshade view of the height-ordered edifice arrangement used to create the perspective image in the poster.
REFERENCES
Bohnenstiehl, D.W.R., Howell, J.K., White, S.M., and Hey, R.N., 2012, "A modified basal outlining algorithm for identifying topographic highs from gridded elevation data, Part 1: Motivation and methods": Computers and Geosciences, v. 49, p. 308–314, doi:10.1016/j.cageo.2012.04.024.
O'Hara, D., L., Karlstrom, D. W. Ramsey, 2020, "Time-evolving surface and subsurface signatures of Quaternary volcanism in the Cascades arc", Geology, v. 48. https://doi.org/10.1130/G47706.1
Wolter, J. A., 1972, "The Heights of Mountains", Quarterly Journal of the Library of Congress, pp.185-205